

Written by Jordan Eliseo, Manager – Listed Products and Investment Research, The Perth Mint
The Exchange Traded Fund (ETF) market continues to grow in Australia,
with more than AUD 20 billion in inflows during the last financial year.
These inflows, combined with a sharp rally in risk assets, has seen assets under management in the ETF market top AUD 125 billion by the end of October 2021, a rise of more than 70% in 12 months.
With more than 200 products for direct investors, advisers and institutions to pick from, the market looks set for years of continued growth, especially given the penetration of ETFs in Australia still lags markets like the United States.
The range of ETF fees is wide
In the early days, the term ETF almost exclusively meant low cost passive investment products
designed to track a specific stock market or asset class. Some of these products are available for management fees (MERs) of less than 0.20% per annum, meaningfully lowering the costs for investors.
In the past few years, the ETF market has evolved, with a notable rise in thematic products, as well as the launch of actively managed funds in ETF form, the latter of which still rely on the skillset of portfolio managers, and charge accordingly.
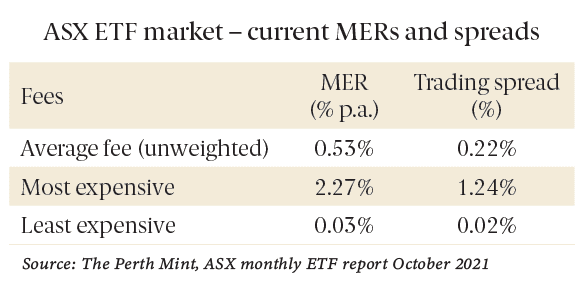
These developments have contributed to a now wide gap between the most expensive and least expensive ETFs, based on MERs and spreads. As the table below highlights, average MERs (unweighted) across all ASX listed ETFs currently sit at 0.53%, with a more than 2% gap between the highest and lowest cost.
What are investors actually paying?
Investors in the ETF market are currently a weighted MER of 0.45% as at October 2021 (lower than the unweighted average of 0.53%), with a larger share of ETF investments sitting in lower cost products.
This weighted MER across the entire industry has increased by 35% since 2017, evidenced through the table below showing the size of the ETF market, the weighted MERs investors are paying, and the implied dollar charges across the industry as a whole.

Where does each asset class sit from a cost perspective?
The graph below highlights the cost of each asset class, relative to the average cost of the ETF market as a whole. Note we have used Perth Mint Gold (ASX:PMGOLD) to represent the precious metal as an asset class.
In essence, if the gold or black bars on the chart are to the left of the zero line, then that asset class has a lower MER and/or spread compared to the ETF market as a whole. To the right, the costs are higher.
With the exception of gold, most alternative assets, from commodities, to infrastructure and currencies, are at the more expensive end of the ETF market, as are global equity strategies concentrated in Asia or emerging markets.
Large cap developed market products, as well as mixed asset and fixed income ETFs, are also typically lower cost relative to the ETF market average.

These cost divergences are one factor for investors and advisers to consider as they allocate capital moving forward, especially given the uncertain investment environment as we head into next year.
To find out more SMSF investor information from The Perth Mint, please visit their webpage here or click below to download the report.
Content provided by:

Disclaimer: Any opinions expressed in this article are subject to change without notice.
The information in this article and the links provided are for general information only and do not contain all information that may be material to you making an investment decision.
The Perth Mint is not a financial adviser and nothing in this article constitutes financial, investment, legal, tax or other advice.
Before making an investment decision you should consider whether it is suitable for you in light of your investment profile, objectives, financial circumstances and the merits and risks involved. You should consider seeking independent financial advice to check how the information in this article relates to your unique circumstances.
All data, including prices, quotes, valuations and statistics included have been obtained from sources The Perth Mint deems to be reliable, but have not been independently verified by The Perth Mint and we do not guarantee their accuracy or completeness.
The Perth Mint does not accept any liability, including without limitation any liability due to any fault, negligence, default or lack of care on the part of The Perth Mint, for any loss arising from the use of, reliance on, or otherwise in connection with the information contained in this article.